
External Author – Preston Boling
Note that this tutorial is not my own work, but was developed by the extravagant Preston Boling and is hosted here for convenience.
Download
Introduction
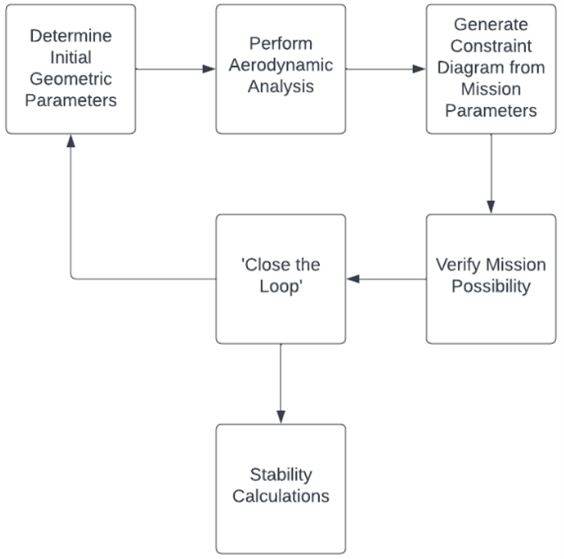
The ‘spreadsheet’ as it is affectionately dubbed by the capstone team as well as anybody who has taken ME461 (Aircraft Design), is the blueprint for conceptually designing planes and determining their flight characteristics BEFORE you build the plane, hopefully so that it works when you do build it. As the years progress this spreadsheet evolves aesthetically, but rarely computationally, so almost all of what you’re about to read here is transferrable to whichever variation of the spreadsheet is actively being taught in ME461. One important thing to note is that this spreadsheet does not consider complex geometry. If your fuselage is not a cylinder, expect that maybe your calculated drag and realized drag will be different. If you are working with a variety of different materials, maybe your skin-friction coefficient is going to be larger than if you do the whole plane in monokote. This spreadsheet is NOT an end all be all, but rather a tool to assist you in designing the right aircraft for your needs. This document does NOT serve as a replacement for ME461, any capstone team which hopes to compete in the AIAA competition should have a minimum of two members well versed in the actual class material. Finally, the standard spreadsheet taught in ME461 is built in one of two configurations, for prop driven gas planes, or engine driven gas planes. It goes without saying that almost all the planes you build with this spreadsheet will be LiPo powered, and propellor driven. Make sure you’re using the propellor variation and consider the equivalencies needed for working with a battery instead of consumable fuel. This tutorial will follow the process presented in Figure 1. Now for the fun stuff.
Geometric Parameters
The first stop on our process loop is the Geometry tab of the spreadsheet. This is where you get to specify how you want your plane to look, if you want a certain sweep, aspect ratio, or planform area, it goes here. This does require you to have a semblance of an idea for your plane, which you’ll likely have taken from any mission requirements presented to you in the competition rules or design constraints they may have presented. For the case of the 2022-23 competition team, we knew that due to a box constraint, we were looking for a planform area of no more than five sqft. Additionally, fabrication is often easiest on a plane with no sweep, and as you don’t typically benefit from sweep until you reach compressible to high Mach flow, setting sweep angle to zero was an easy choice for us. For the same reasons, we set our taper ratio for the wing to one. None of these are concrete though, and there’s no harm in experimentation. The location of max thickness refers to the normalized distance along the chord length of your airfoil where the thickness is maximum. This varies from airfoil to airfoil and is important to update as you consider different airfoils, as it helps the spreadsheet predict the flow over your wing. Once you have those first parameters picked out, the spreadsheet will show you what your wing looks like in the form of graph, as well as give you some other important information, like your mean geometric chord length as well as your wingspan. In Figure two you can see the values we put in on the left, and what the spreadsheet computes for you on the right.

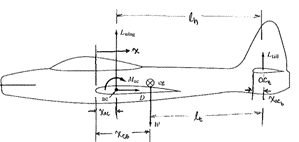
Now that you’ve determined your wing geometry it’s time to consider your tail geometry, as well as some other important parameters like the fuselage length and diameter. This can be found in the bottom half of the Geometry tab on the spreadsheet. This is presented similarly to the top half, on the left-hand side highlighted in yellow are the parameters you’ll pick, the equivalent parameters for the tail as you did with the wing, and then vertical and horizontal tail ratios. Hovering over the cells with red ticks on them will display helpful notes about typical sizing information, or important considerations to remember when choosing values to put in. Like last time, the spreadsheet will then provide you with information about how long your fuselage should be, and about where you’ll place it relative to the wings and tail. These are approximations and can be experimented with to varying degrees of success. Shown in Figure 3 are some of the more ambiguous variables the spreadsheet gives you mean, such as LT and LH. Use this figure to prototype your airplane correctly.
Aerodynamic Analysis
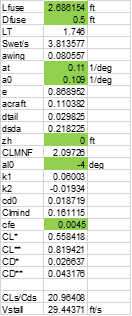
Now that we’ve got the physical parameters hammered out (almost), we get to move on to the more theoretical aspect of the design. The Aero Analysis tab goes into some heavy-duty math, which is covered in ME305, ME461, and ME405. While taking ME461 is enough to know what to make of this page, ME405 goes into a lot of the assumptions that the spreadsheet makes and can also help inform you of what a lot of these parameters really mean. For the purposes of this tutorial, I will only be discussing what the values highlighted in green are, as those are the parameters you get to choose and need to understand. The first value you’ll pick is LFuse which stands for fuselage length. The previous tab gives you an acceptable range of lengths to pick from, and you should choose a length which makes sense for the competition that you’re flying. The next option is DFuse, which is the fuselage diameter. This spreadsheet assumes you’re building a completely cylindrical plane that is wasped, if your plane is not going to be a cylindrical plane (very likely), do your best guess of an approximate diameter. The next values are at and a0 which refer to the two-dimensional lift curve slope of your airfoil for the tail and wing, respectively. These can be read directly from NACA data for the airfoil of your choosing. If this is above your head, pick 0.10 as a conservative guess. ZH refers to the height above the chord line of your wing that the chord line of your tail is at. If your wing and tail are in-line, this value will be zero. Next is aL=0 which is the angle of attack at which your airfoil experiences no lift, which can be determined by the specific airfoil you pick. If this is something you cannot determine for your airfoil, a heavily conservative estimate is 0, but -2 is often standard. Finally, CFE is the skin friction coefficient of your entire aircraft. 0.0045 is a decent estimate, this is probably not the largest concern you’ll have in designing your aircraft. When all of this has been determined, the spreadsheet will spit out a plethora of important information. Some of the key values are the maximum lift to drag ratio coefficients, denoted by CL* and CD*, as well as your parasitic drag, CD,0 and your maximum lift coefficient CLMNF. It is also able to give you some important information in this tab like stall speed and your drag polar, which graphically relates your lift and drag coefficients. Pictured in Figure 4 are nearly all the previously discussed parameters as they appear in the spreadsheet.
Constraint Analysis
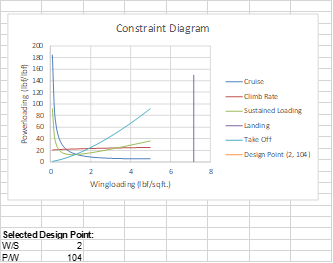
The constraint analysis will take your geometric parameters and your aerodynamic parameters and use those to give you a visual aid for the physical performance of your aircraft. The Master Constrain Equation (MCE) is a particularly useful tool for visualizing aircraft performance. This equation relates the physical acts being performed by the aircraft to the wingloading and powerloading of your aircraft. The wingloading of your plane is the weight in pounds of your plane at takeoff divided by the planform area of your plane in sqft. The powerloading varies based upon whether you are working with a propellor based plane or one which has an engine, but for DBF purposes the powerloading will relate the thrust being produced by your plane in pounds to the weight of the plane in pounds. By modifying the MCE for certain scenarios like cruising, climbing, or sustaining a load (turning) and then plotting each of these constraints as a function of wingloading to solve for powerloading, you can create a constraint diagram that shows you for a certain wingloading value what the minimum powerloading value you need to spec your plane to. This influences your motor/propellor/battery choices very heavily. The wingloading you pick determines what fabrication techniques you can use and often comes at a tradeoff of structure. Additionally, situations like taking off and landing in certain distances are plotted on this graph, but notably do not use the MCE. The criteria you specify, such as cruise speed, climb rate, sustained loading factors, take off/landing distances are all available for you to change in the ‘Desired Criteria’ tab. This tab is built to contain the bare minimum information needed for designing a plane but can also evolve to contain information regarding topics like the antenna which the 2022-23 team had to account for. As a general rule of thumb, the higher you can spec your powerloading and the lower you can make your wingloading without violating any of the constraints is the best choice. Once you’ve settled on a wingloading/powerloading combination make sure to update that below the graph, as it will affect information like stall speed, and your mission specific pages. An example of a constrain diagram can be seen in Figure 5.
Mission Analysis
Up next are the mission analysis tabs, which for the AIAA competitions will likely mean three tabs labeled Mission 1, Mission 2, and Mission 3. These tabs can be created and used at the discretion of the team and are how you determine if your plane can fly a certain mission with your battery/motor/propellor/airplane configuration. When considering what to include in a mission analysis tab ask yourself what the plane will be expected to do during each mission. For example, if Mission 2 requires you to carry a payload that is 30% of the planes gross weight, and then fly as many laps as possible within ten minutes, your Mission 2 tab should consist of take-off, climb, and cruise, all at 130% of your standard weight. The next thing you should consider is that the cruise equation does not consider time flown, but the distance traveled. So, using your knowledge of the flight course, your cruise speed, and a healthy factor of safety, you can estimate the time it would take to complete a lap and convert that into an expected number of laps flown during that mission. When all is said and done, the purpose of these pages is to guarantee you can complete a successful flight without running out of battery.
Sizing
Now comes the fun part of aircraft design, the sizing aspect. Taking everything, you’ve said you want your plane to be able to do, and everything that you’ve calculated your plane can do, we need to guarantee that this plane can be built using modern manufacturing/fabrication methods. This is like a double check to ensure that if you’re building this plane out of carbon fiber and fiberglass, you’re not also expecting it to weigh as much as a feather. Therefore, the sizing tab uses approximations of actual fabrication processes and back calculates what an expected planform area for the things you want your plane to do would be. It then compares this to the planform area you initially provided all the way back on the geometry tab, and so long as you’re within a 1% match, you’re good to go. If you’re using the ME461 spreadsheet, the values put into this page have been collected from decades of industry standards and averages and are very good for the purposes of the class. In the case of DBF, some of these values don’t compare between an F-15 and a balsa wood plane. For that reason, the 2022-23 capstone team has updated the sizing tab to consider materials typically used by the team, such as balsa wood, fiberglass, and monokote. In Figure 6, the values in green are what you’re free to make changes to, such as the weight of the battery you’re using, or the weight of the landing gear you want on your plane. By determining these values ahead of time, it helps zero in on the plane design that will work best for you. Note that Wwing/S is determined to be 0.4 for wings made from balsa wood, an internal spar structure, and foamboard. If utilizing heavier materials, it will be important to recalculate this number to accurately represent the plane you plan to build. This goes for many of these values in green, estimate to your best ability the weight of these subsystems and then input them into the spreadsheet normalized by your theoretical planform area. Once this step is done, if your % difference is not < 1.0%, it is time to start iterating. Make small changes to your value of wingloading, as well as other things like the planform area and aspect ratio. Sometimes adjusting tail values on the geometry tab has a larger influence than you would expect. Maybe try and pick a different airfoil, and update those values under the aero anlys tab. There is no single correct answer here, it is a matter of continuously changing your optional values until you settle on an option close to what you’re looking for.
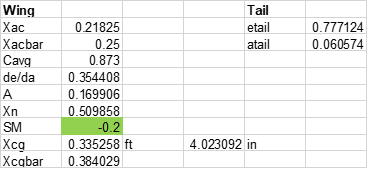
Stability
Now that you’ve got a plane spec’d out, what else is there to do but fly it? Balance it. The stability tab has one value for you to change, and that is the Static Margin. Keep your static margin between values of -0.1 and -0.3, where the lower the value you pick will produce a stabler aircraft, and the higher the value you pick provides better longitudinal control. After choosing your static margin the spreadsheet will give you a CG. Mark that many inches back from the leading edge of your wing and balance the plane so that it does not pitch in any direction when held at points in that position. The spreadsheet’s appearance is shown in Figure 6.